Use case WF 2
Relationship between net photosynthesis activities and temperature in the natural forest
This case study will analyse the variation in net photosynthesis activities in terrestrial environments in relation to temperature, using satellite-derived time series. Specifically, it will estimate the temporal variation of net photosynthesis activities. Starting with vegetation indices, which enable the identification and analysis of chlorophyll and leaf water content, two key components of the photosynthetic process, the study will evaluate the influence of biotic and abiotic variables on terrestrial productivity.
Dataset
The study focused on monitoring changes in net photosynthesis activity (PsnNet) within the Foresta Umbra for the period 2004–2024, using the MODIS MOD17A2HGF product.
To identify the main drivers of the observed temporal variations and try to make predictions about future developments, additional datasets were employed:
- (LST), directly derived from the MOD21A2 v061 product;
- Leaf Area Index (LAI), representing the total leaf surface area per unit ground area, obtained from the MCD15A2H product;
- Reflectance bands b1, b2, and b6 from the MOD09A1 v061 product, used to compute the vegetation indices NDVI (Normalized Difference Vegetation Index) and NDII (Normalized Difference Infrared Index).
Furthermore, a shapefile representing the Special Area of Conservation (NATURA 2000 network) of the Foresta Umbra, characterized predominantly by the priority habitat 9210* – “Faggete degli Appenini with Taxus and Ilex” (Habitats Directive 92/43/EEC), was used to extract, from all selected products, the pixel values falling within the area of interest.
Method
Starting from the MODIS products, historical time series from 2004 to 2024 were constructed for PsnNet, LST, and LAI. Using the reflectance bands, the following vegetation indices were also computed:
- NDVI = (Band 2 – Band 1) / (Band 2 + Band 1), used to estimate variations in chlorophyll concentration in vegetation;
- NDII = (Band 2 – Band 6) / (Band 2 + Band 6), used to estimate variations in vegetation water stress.
To reduce residual noise in the vegetation index time series (NDVI and NDII), an asymmetric Whittaker smoothing filter (Asymmetric Whittaker Smoother) was applied. This approach attenuates the influence of positive outliers caused by atmospheric contamination and cloud cover, while preserving the true seasonal variability of vegetation.
For each time series, the following analyses were carried out:
- For each eight-day composite, the mean value of each variable was calculated for the study area in order to construct time series of PsnNet, LST, LAI, NDVI and NDII. Where scenes were missing, gaps in the time series were filled by replacing the missing values with the average of the preceding and following observations.
- Recurrence plots were generated in order to explore the dynamic behaviour of the time series, and to identify any anomalies, regime shifts or transitions in the evolution of the signal. This method enables the visualisation of recurrences and temporal structures (such as periodicity, clustering and discontinuities) that may not be apparent through a simple graphical inspection of the series.
- The presence and statistical significance of monotonic trends in the time series were assessed using the non-parametric Mann–Kendall test. This test can detect monotonic trends (i.e. an increase or decrease) regardless of the data distribution, making it particularly suitable for ecological and climatic series.
- Spline curves were derived for each time series in order to visualise and describe data dynamics continuously, and to identify potential long-term trends and seasonal or interannual patterns more clearly.
- Finally, a SARIMAX model (Seasonal AutoRegressive Integrated Moving Average with eXogenous regressors) was applied to estimate an evolutionary scenario for PsnNet, including as exogenous variables the main descriptors of vegetation status and surface thermal conditions: LAI, LST, NDVI, and NDII.
Results
The recurrence plots reveal a pronounced diagonal structure, which is indicative of significant seasonality and suggests highly deterministic dynamics, with low entropy and good temporal stability. Both NDVI and NDII exhibit some short-term disturbances, with a good response, as evidenced by small interruptions and fragmentation of the diagonal structures. (Figure 1).
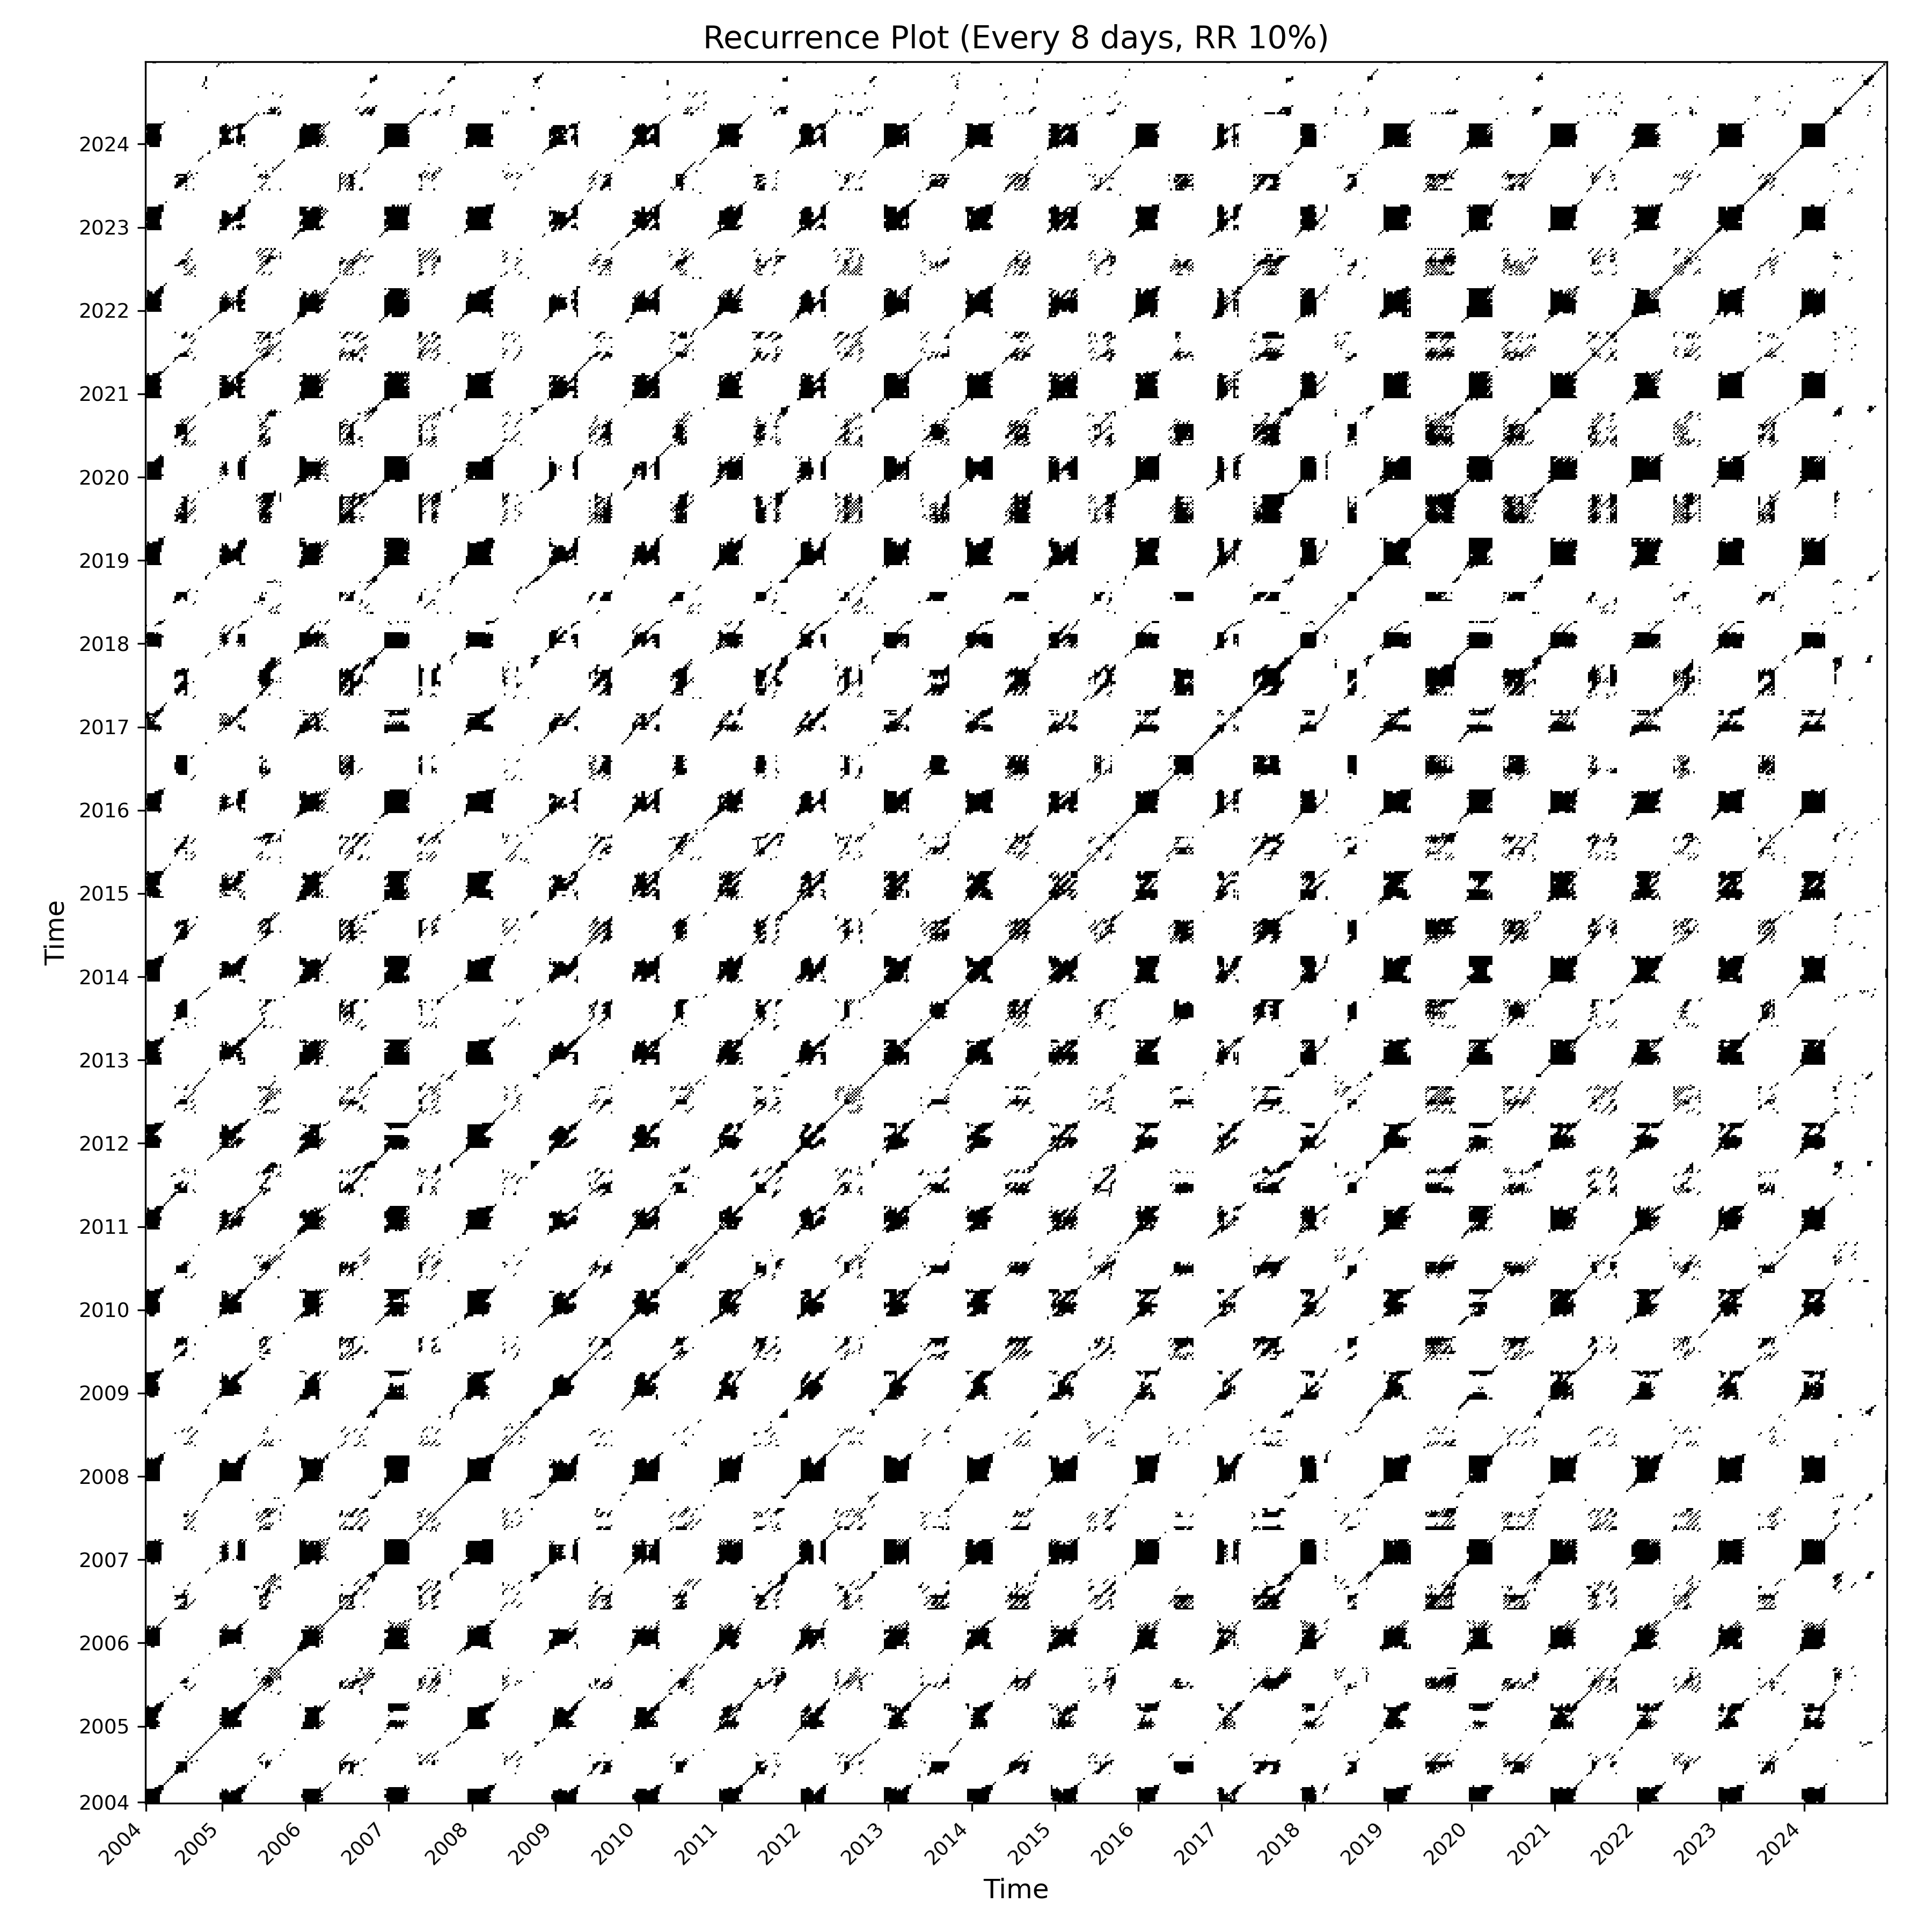
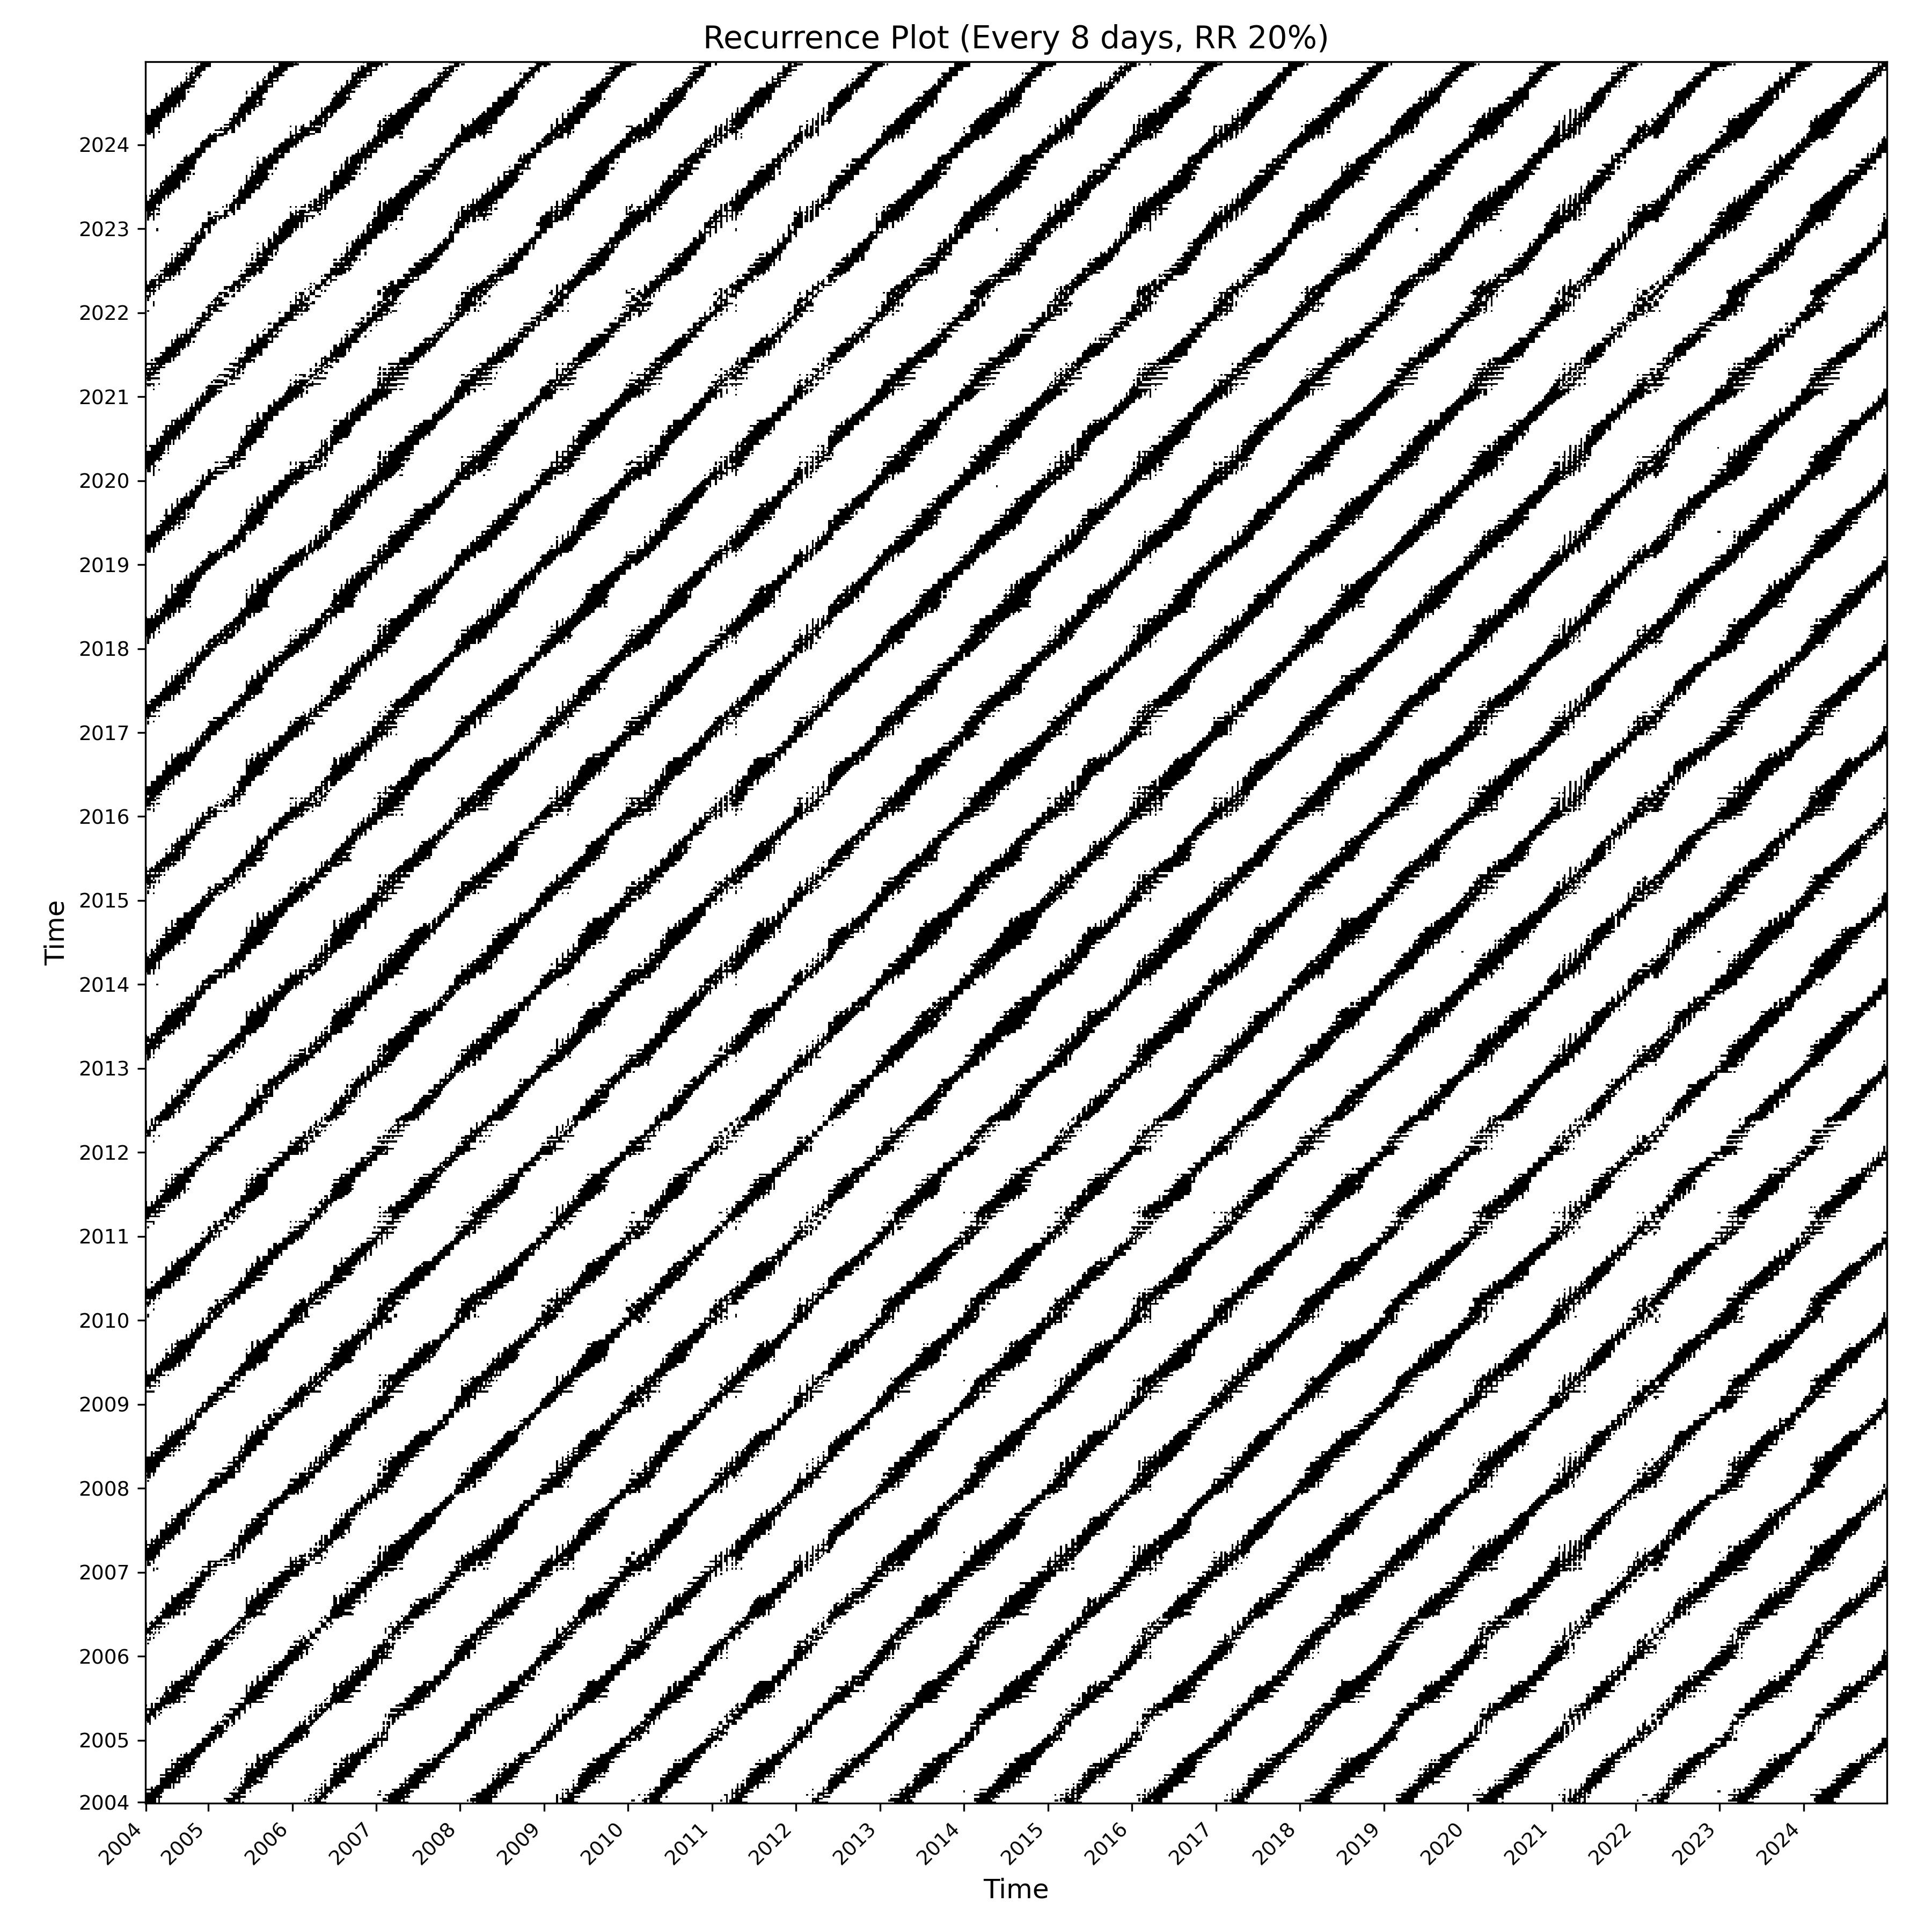
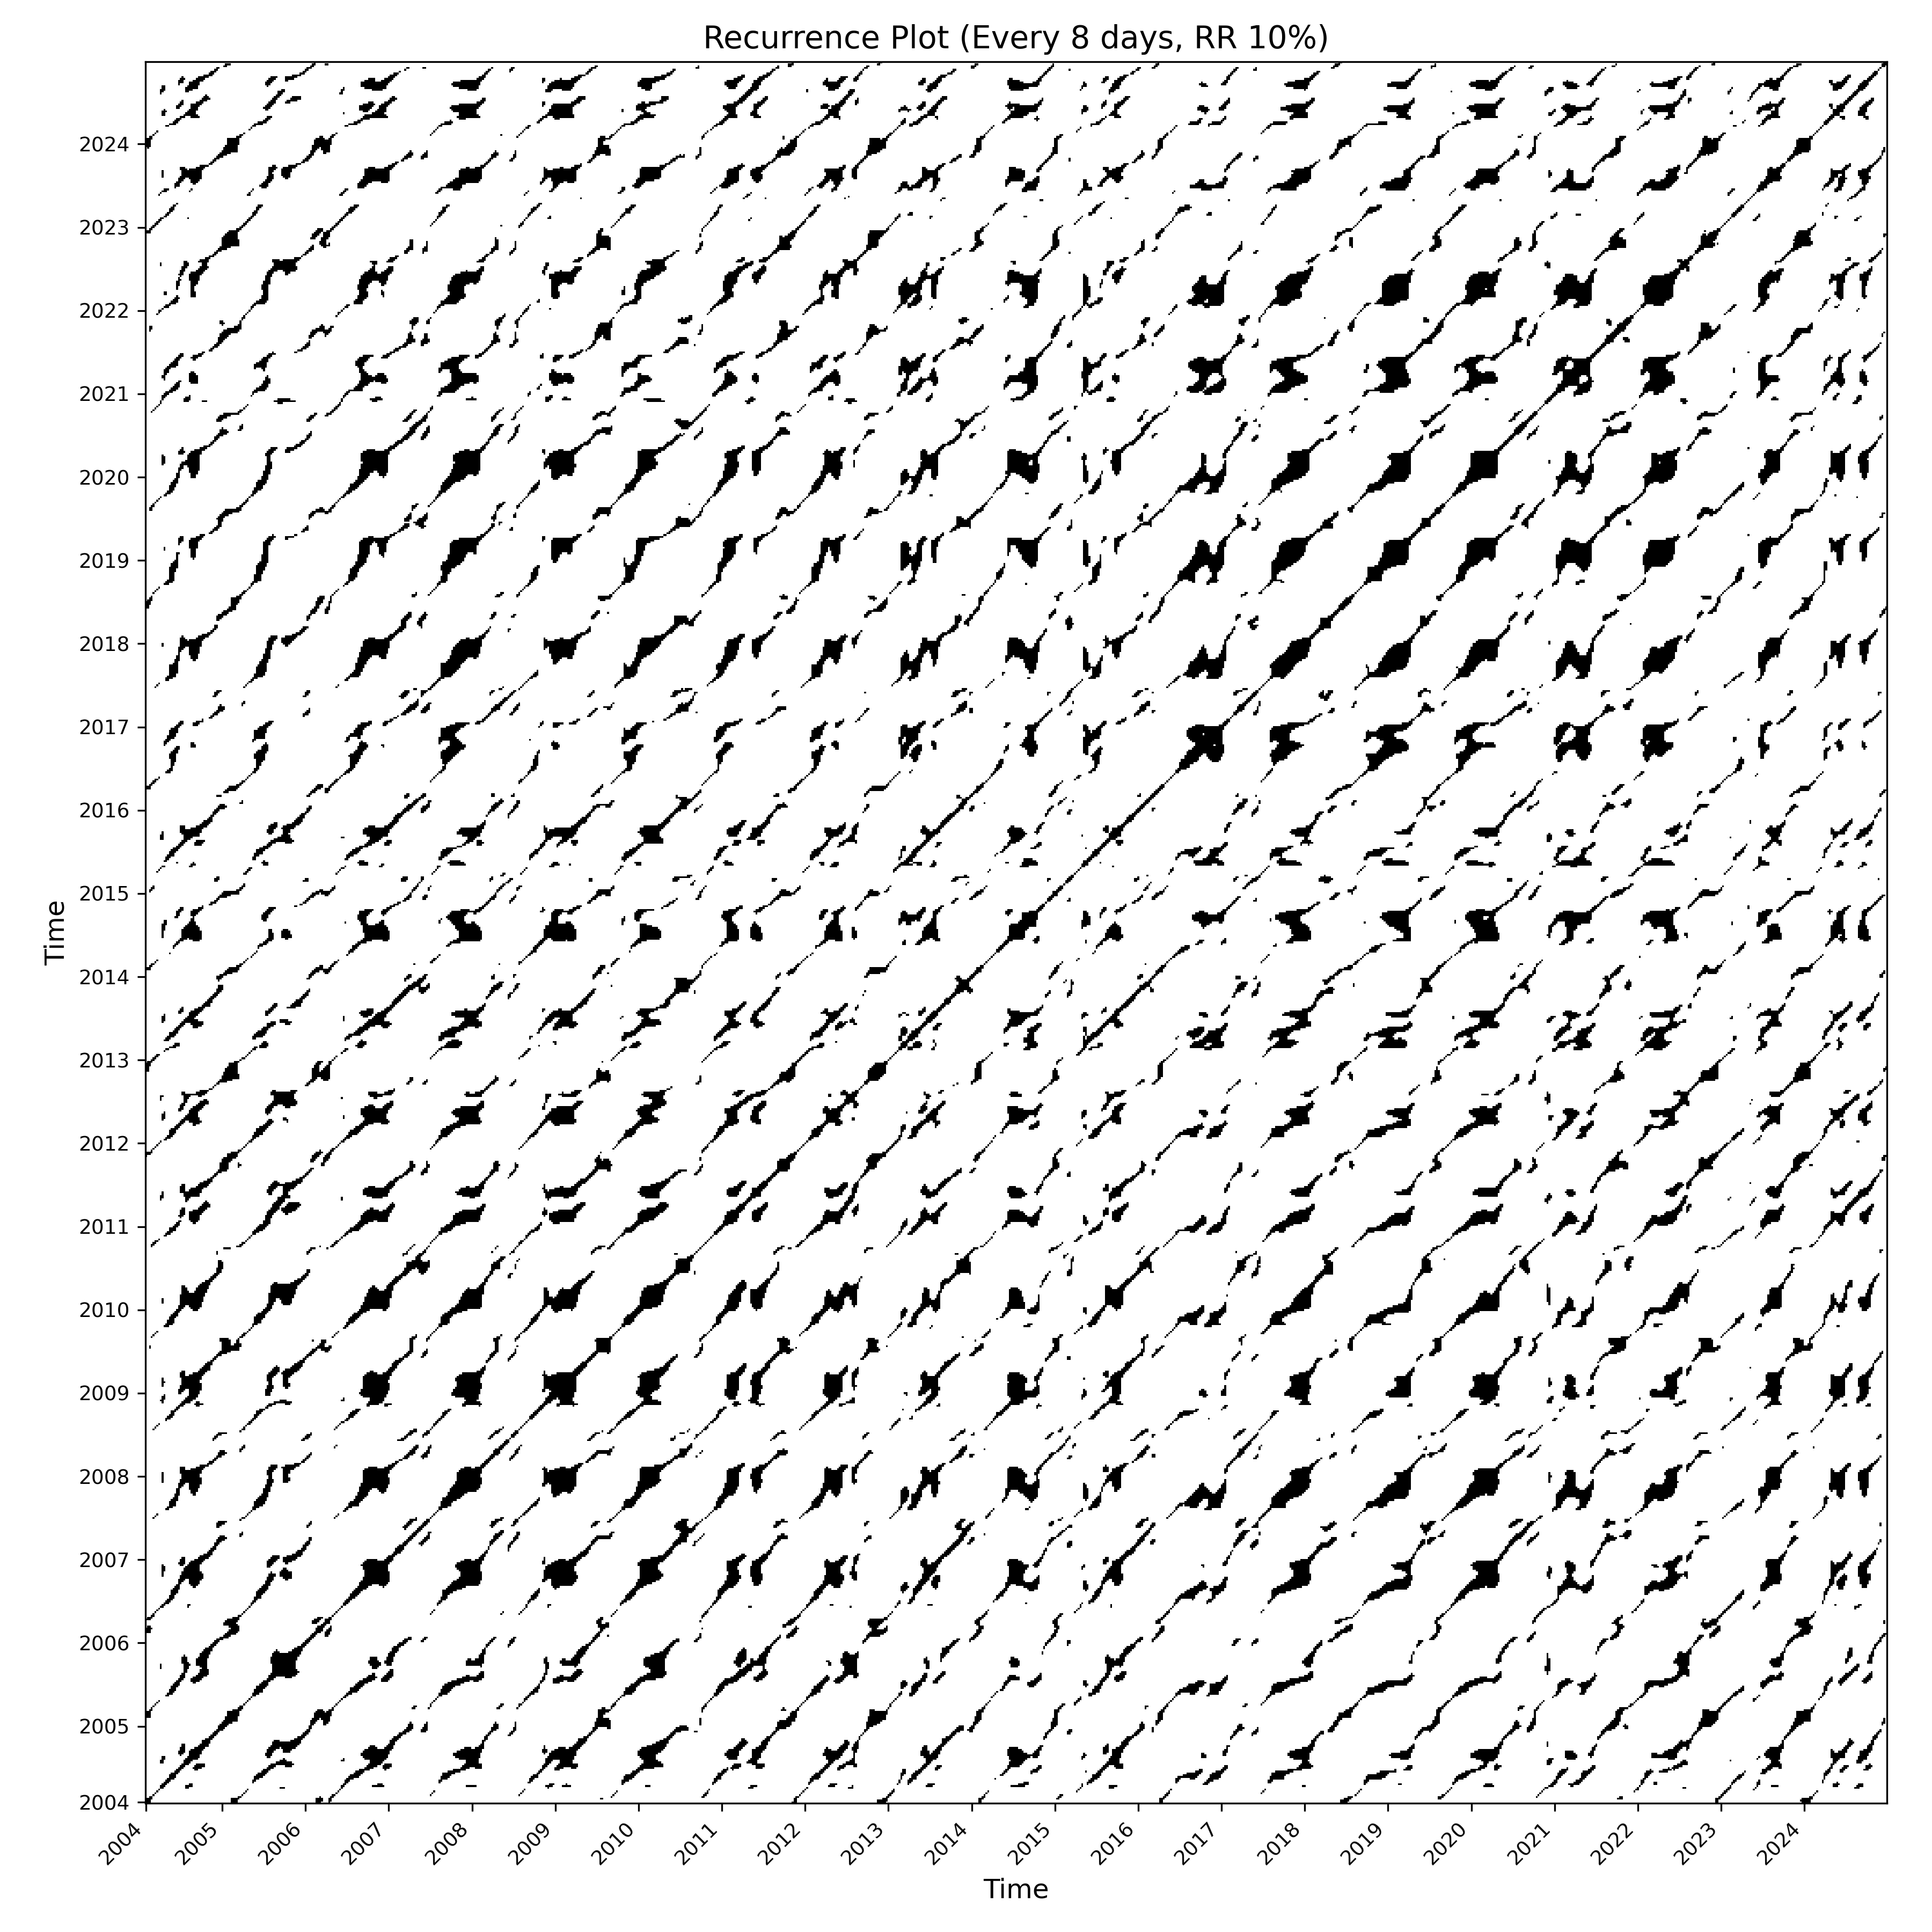
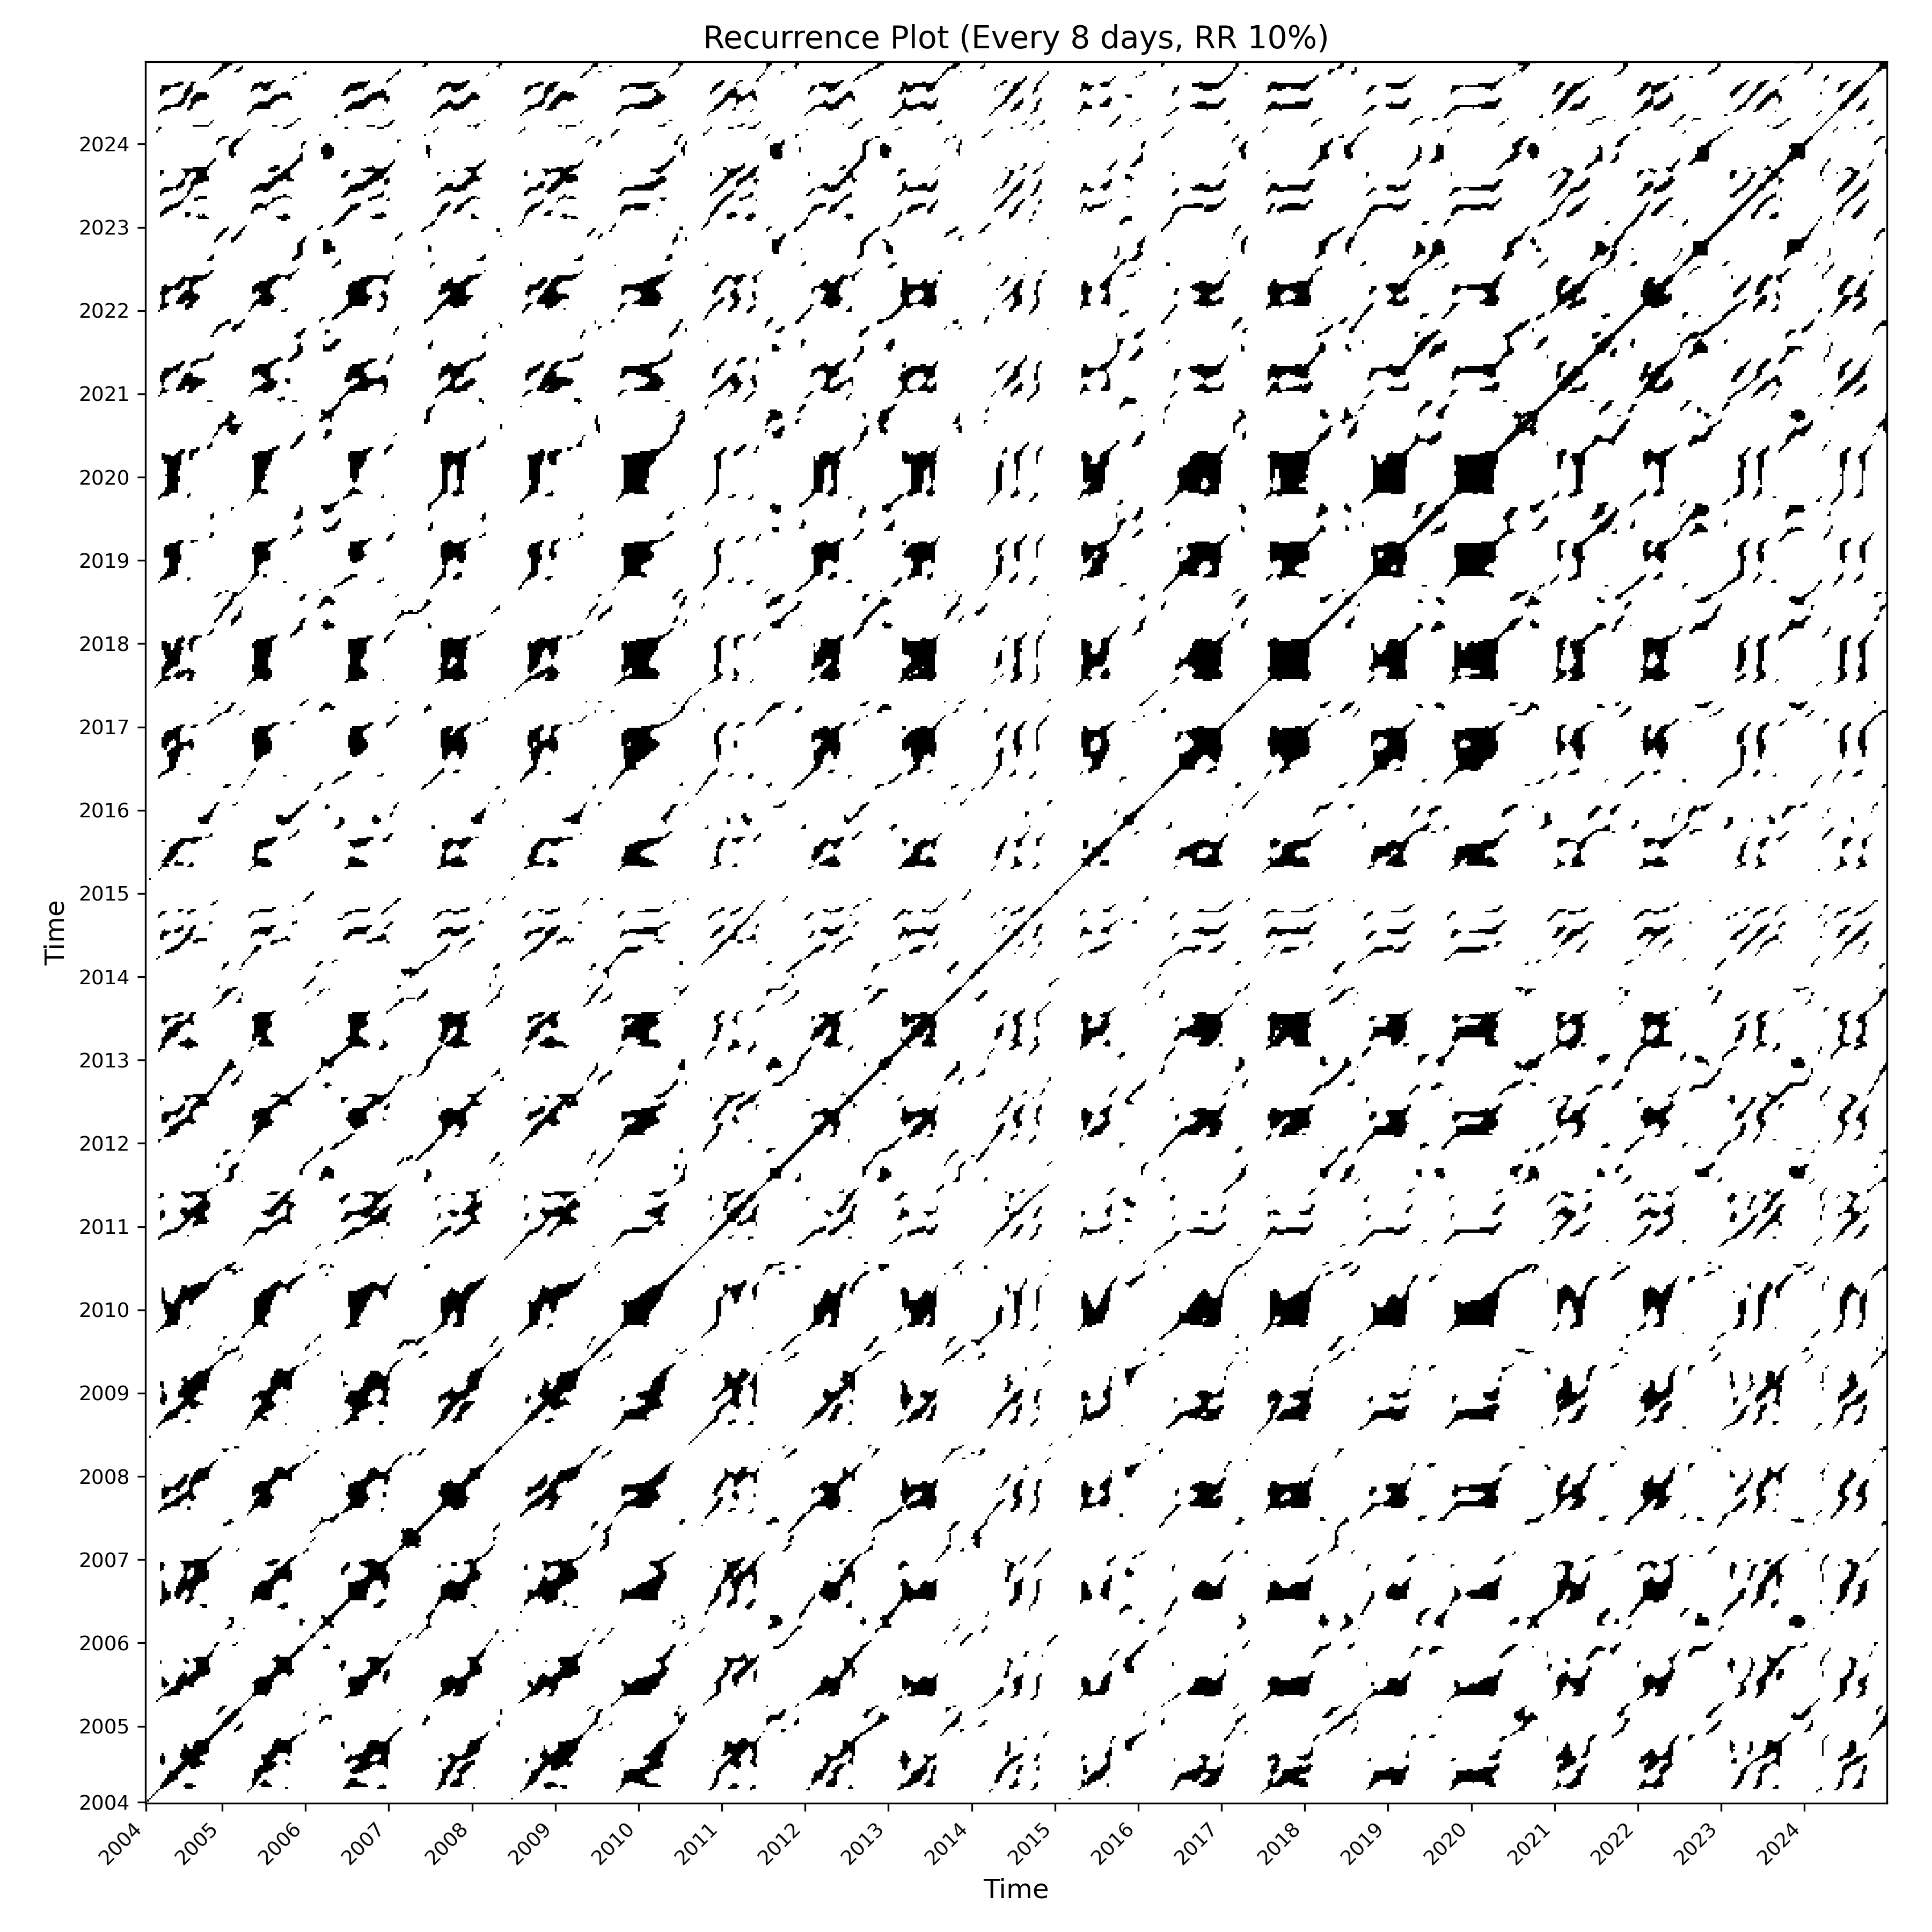
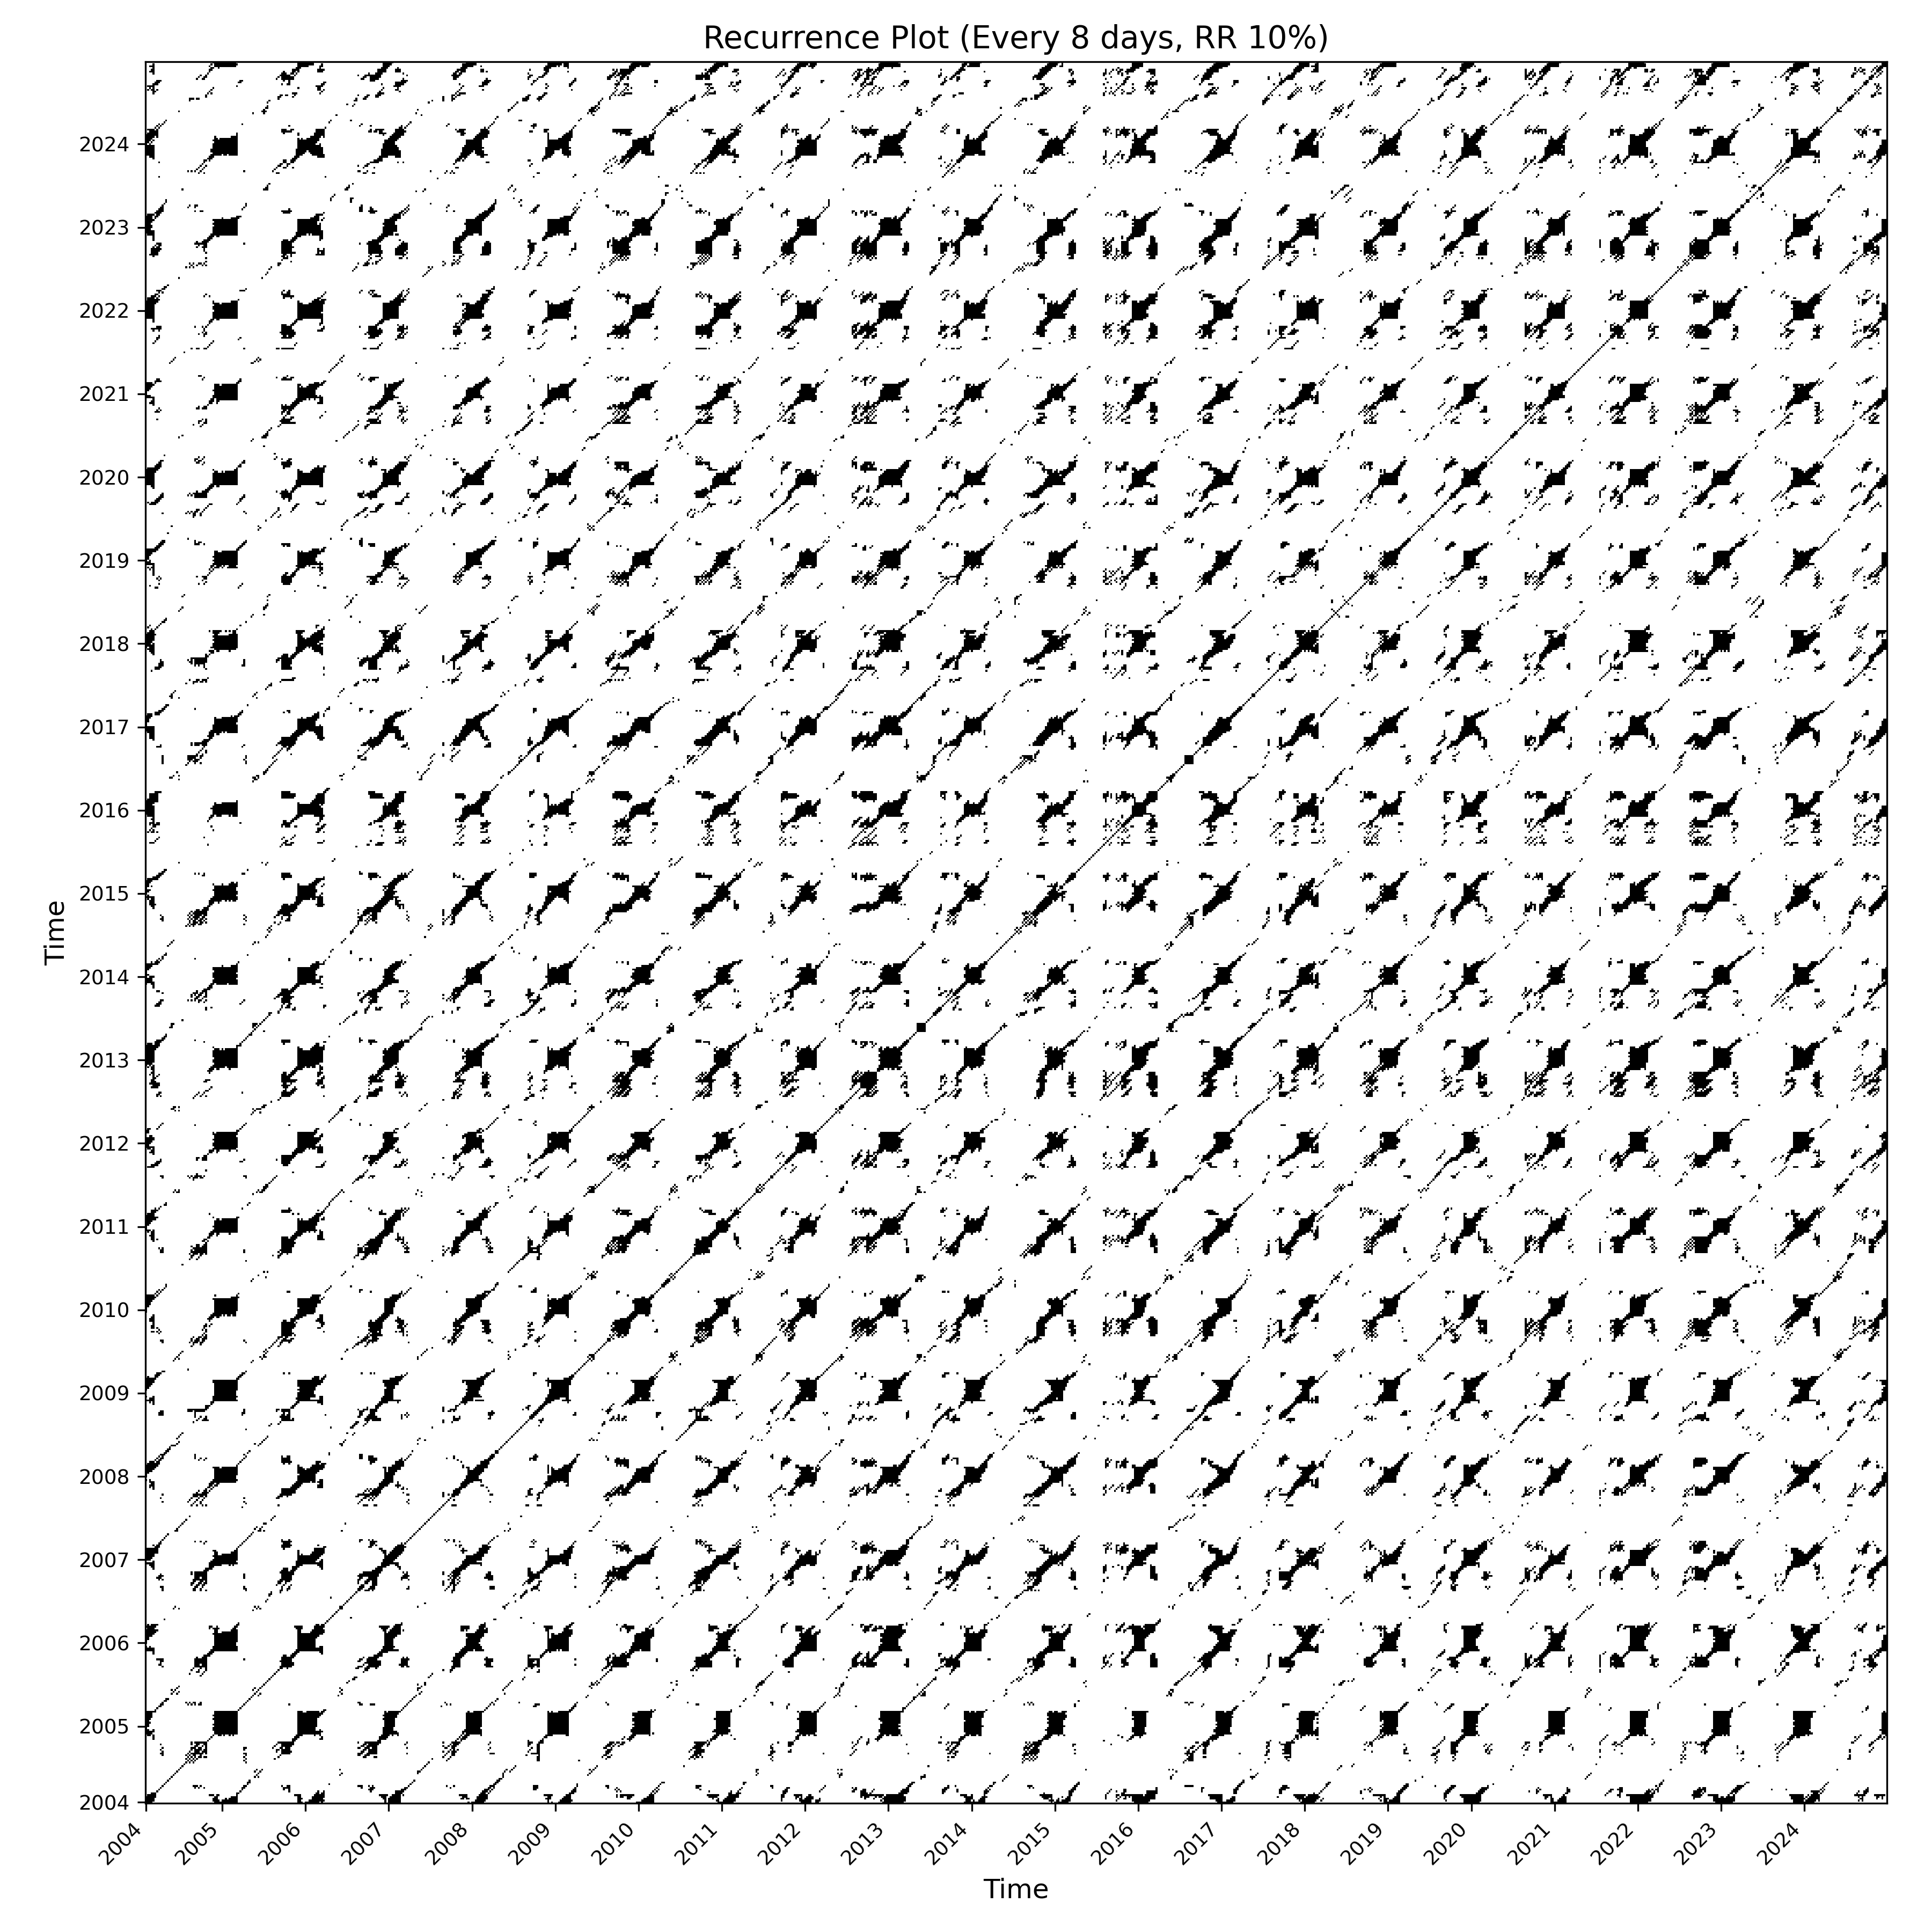
Figure 1. Recurrence plots: a) LAI; b) LST; c) NDII; d) NDVI and e) PsnNet.
Long-term trend analyses using non-parametric methods (Mann–Kendall test) and robust slope estimation (Theil–Sen estimator) reveal a very weak (τ very low) and statistically non-significant slope (Pvalue >0) across all time series examined (Table 1).
Table 1. Results of the trend analyses of the time series
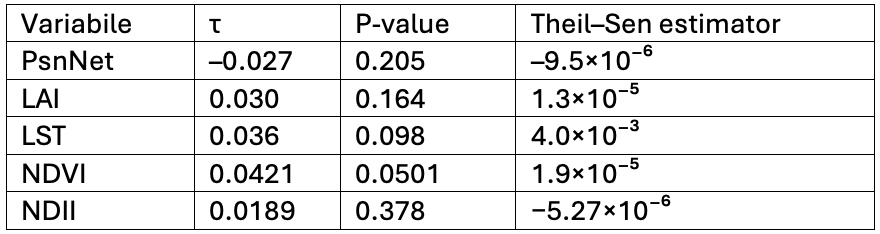
Such results indicate the absence of any relevant monotonic trend over the entire observational interval. To visualize possible internal changes in time series tendency, even of small magnitude, spline curves were examined for each time series:
- PsnNet: The smoothing spline reveals a very slight downward trend across the entire period. Mean values remain relatively stable in the central part of the series, while a slight decline is observed in the initial and final segments (Figure 2).

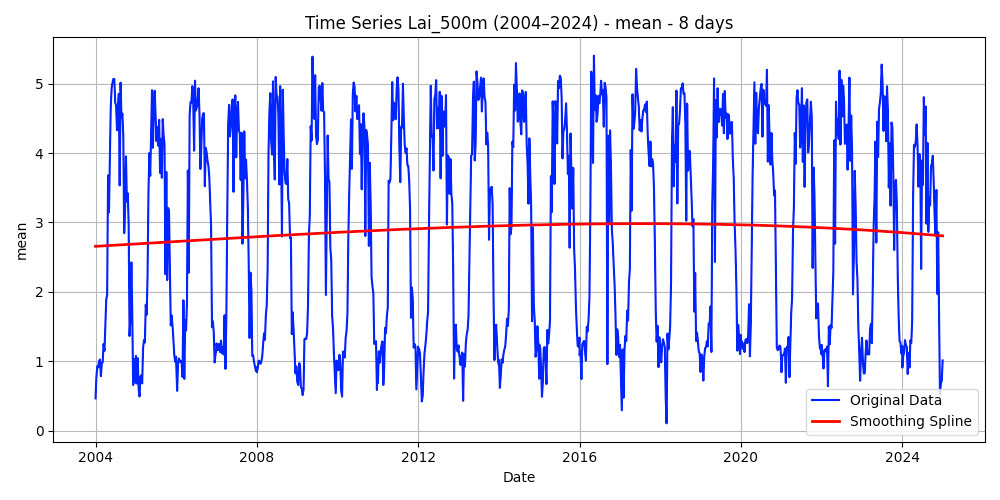
- LAI: The spline shows a very mild increasing trend throughout the full time interval. Mean values remain largely stable in the central portion, with a slight increase at the beginning followed by a mild decrease toward the end (Figure 3).
- LST: The smoothing spline indicates a very gentle upward trend, with mean values showing an increase in both the initial and final parts of the series, followed by a stationary phase in the central segment (Figure 4).

- NDVI: The spline shows a very mild overall increasing trend, with mean values decreasing in the initial portion of the series, followed by an increase in the central period and a slight decline in the final segment (Figure 5).

- NDII: The smoothing spline exhibits an almost stationary long-term background pattern, lacking any clear directional change and instead characterized by gentle temporal modulation. Mean values show an initial decrease, a central increase, and a slight decline in the final segment (Figure 6).

Future development scenario of PsnNet
The SARIMAX model for PsnNet was developed using LST and vegetation descriptors (LAI, NDVI, NDII) as exogenous predictors, projected forward in time to support near-term estimates of PsnNet. A temporal resolution of 16 days was adopted, with 23 observations per year (Figure 7A).
The SARIMAX analysis shows that the selected specification adequately captures seasonal dependence and the temporal dynamics of the signal. Residual diagnostics support the statistical validity of the model (Figure 7B and Figure 7C). The burn-in period was applied to the analysis of the residuals because the initialization phase required by seasonal differencing and by the recursion of the autoregressive and moving average (AR/MA) components makes the initial residuals more unstable and less representative. For this reason, the residuals corresponding to the first two complete seasonal cycles were excluded from the analysis, so that the model’s performance could be evaluated in the period where the dynamics have stabilised, providing a more reliable assessment of the residuals. The Ljung–Box test indicates no significant residual autocorrelation (p > 0.05), suggesting that the temporal structure of the noise has been effectively removed. Consequently, valid residuals only appear after the first few years of the series, which is expected and consistent with the model’s structure. The heteroscedasticity test is non-significant (p > 0.05), supporting the assumption of constant variance. The Jarque–Bera test is significant (P < 0.05), indicating mild non-normality, but not to a degree that suggests serious model misspecification. Overall, the residuals behave consistently with white noise, with constant variance and no systematic bias, satisfying the key assumptions for valid inference on the covariate effects.
Overall, the SARIMAX model highlights a statistically relevant role for three of the four exogenous variables in modulating the evolution of the target variable (PsnNet). Specifically, the model suggests that the dependent variable is more sensitive to structural canopy and water of vegetation (LAI, NDII) and to thermal conditions (LST), whereas NDVI appears redundant or less informative in this context. The LST shows a low negative and highly significant coefficient (p < 0.05), indicating that, all else being equal, an increase in temperature is associated with a reduction in mean PsnNet, consistent with possible thermal stress or less favorable conditions for productivity. The LAI displays a positive coefficient of relatively large magnitude and high significance (p < 0.05), suggesting that increased biomass or canopy density substantially enhances the target variable. Similarly, The NDII has a moderately positive and significant effect (p < 0.05), consistent with greater water availability or improved canopy water status. By contrast, the NDVI is not statistically significant (p > 0.05), indicating that its additional information on the target variable is limited.
In the future evolution of PsnNet, the Kendall test shows no significant monotonic trend in the series: Kendall’s tau is weakly negative but non-significant (p > 0.05). Over the analyzed period, PsnNet exhibits pronounced seasonal oscillations but no significant long-term trend, either increasing or decreasing.
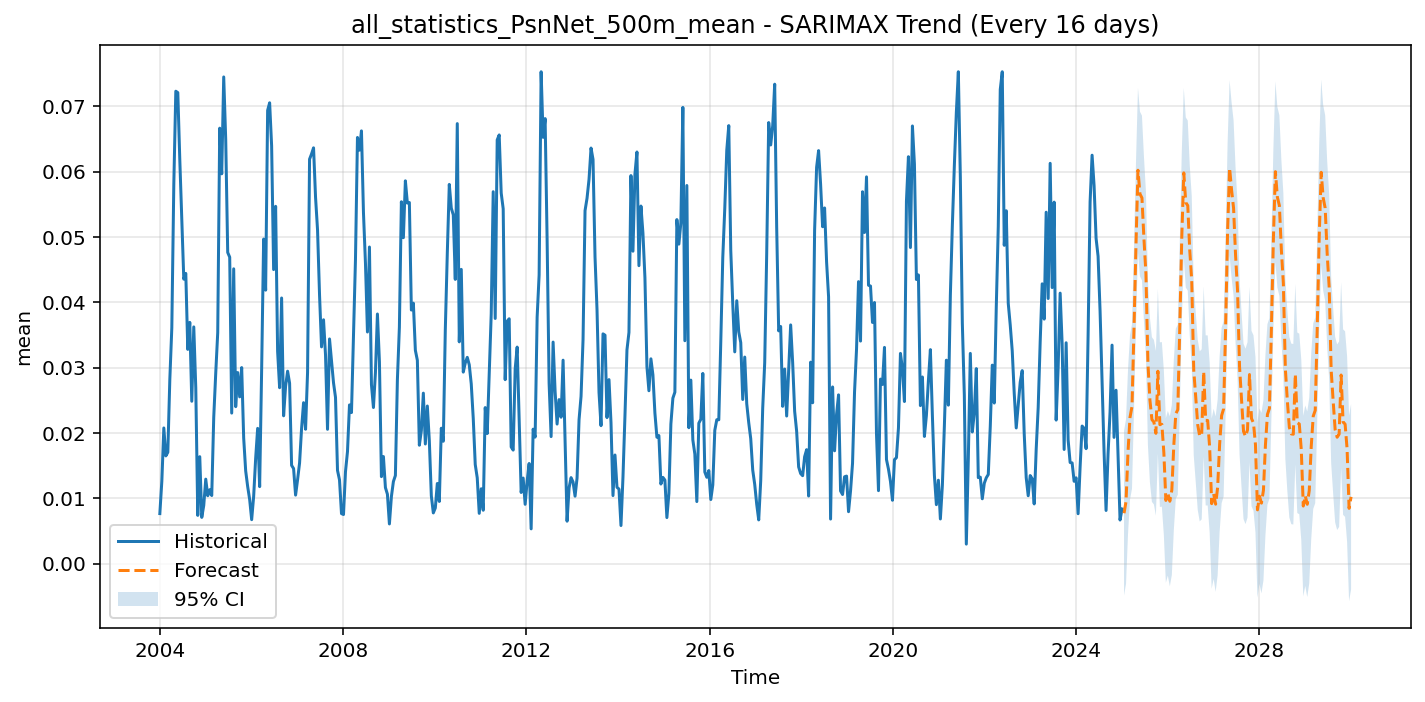

Figure 7. a) Time series of PsnNet and 5-year forecast obtained using the SARIMAX model (16-day resolution), with 95% confidence interval. b) Model residuals, showing no evident temporal patterns and distribution of the residuals, approximately symmetric and centered around zero, confirming the good adequacy of the model.
Technical Notes
The analysis performed demonstrates the methodology that can be developed using WF2. The flow and individual actions can be parameterised to adapt the analysis to the requirements of different users. Other MODIS products (e.g. MOD16A2GF) can be used that were not included in this case study, and other vegetation indices can be calculated and incorporated into the analysis. Users can select the area of interest using their own SHP file.